NAEP RESULTS
A National Parents Union Special Report
INTRODUCTION
Established in 1969, the National Assessment of Educational Progress (NAEP) is the largest continuous and nationally representative assessment of what students know and can do in key subject areas in every state. Serving as a critical tool for evaluating the educational performance of students in the United States, NAEP results guide policymakers, educators, and stakeholders in understanding trends, identifying achievement gaps, and shaping evidence-based educational policies.1 It is the only assessment that provides comparable data on student achievement for each state.
The release of the 2024 NAEP scores come at a pivotal moment for U.S. education, as students continue to recover from the profound disruptions caused by the COVID-19 pandemic. In 2022, NAEP results revealed significant declines in reading and mathematics scores – the largest drops in decades – underscoring the urgency of addressing learning loss and the inequities exacerbated by the pandemic.2 The 2024 results shed light on whether recovery efforts have borne fruit, or if systemic challenges persist.
This paper aims to analyze the 2024 NAEP results, interpreting their significance within the broader context of U.S. educational policy and practice. By examining national trends, state- by-state performance, and subgroup data, we aim to provide a comprehensive analysis of their implications for policy, equity, and the future of education in the United States.
WHAT IS NAEP?
Often referred to as the Nation’s Report Card, NAEP is designed to offer a comprehensive and objective measure of student achievement across a broad spectrum of subjects in each state. Given every two years by the National Center for Education Statistics (NCES), it serves as a means for assessing student performance trends over time, identifying disparities in achievement among various demographic groups, and providing a critical lens into the state of U.S. education.3 The primary purpose is to provide a comprehensive measure of U.S. student performance over time at the national, state, and, in some cases, district levels, and across diverse geographic and demographic groups. The results inform decision-makers about the strengths and weaknesses of the education system, offering evidence-based insights that can guide policy development and resource allocation.
Unlike state-specific assessments, which vary in scope and standards, NAEP provides a consistent measure of academic performance across the country, making it a valuable benchmark for interstate comparisons and the evaluation of long-term trends.4 NAEP tests fourth, eighth, and twelfth grade students in a broad range of subjects, reflecting the diverse skills and knowledge that are foundational to student success. Core subjects such as reading and mathematics are typically administered every two years to monitor key academic competencies. While additional NAEP assessments in other areas of study—including science, history, civics, geography, writing, and the arts—are conducted less frequently, they provide insights into areas of learning that are critical for preparing students to be informed citizens and competitive in a global economy.5
One of the defining features of NAEP is its nationally representative sampling methodology. Each assessment cycle involves a carefully designed sample that represents the diversity of the U.S. student population, including variations by state, urban versus rural settings, and demographic subgroups such as race, ethnicity, gender, and socioeconomic status. This sampling approach ensures that NAEP results reflect the performance of all students, providing insights into achievement gaps and educational equity. Additionally, by conducting assessments of students in grades four, eight, and twelve, the assessments capture results at critical stages of academic development.6
Reading and mathematics assessments are typically administered every two years, while other subjects are assessed on a rotating schedule determined by the NAEP Governing Board. This rotation allows the assessment to cover a wide array of disciplines over time while maintaining a consistent focus on foundational subjects. This cycle ensures that policymakers and educators have access to up-to-date data on student performance in critical areas to enable timely responses to emerging trends. Assessments are carefully timed to align with academic calendars and minimize disruptions to schools. They are administered under standardized conditions to ensure consistency and reliability in the data.7
WHAT ARE THE HISTORIC TRENDS OF NAEP?
At its inception, NAEP focused on assessing basic subjects such as reading, mathematics, and science, which reflected the priorities of the era. The assessments were administered to a small sample of students and were entirely paper-based. Early NAEP reports provided limited data and focused on aggregate results rather than detailed breakdowns by demographics or geographic areas. Despite its initial limitations, NAEP quickly established itself as an important resource for understanding educational outcomes on a national scale.8
Over the decades, NAEP has undergone significant transformations to enhance its relevance, accuracy, and utility. These changes include advancements in assessment design, the expansion of subjects tested, and innovations in data reporting. In the early 1990s, the introduction of state-level NAEP assessments allowed for more granular comparisons of student performance across states. This fostered accountability and encouraged state-level education reforms. In 2001, state participation in NAEP became mandatory for any state receiving federal education funds.
In the 2010s, NAEP leveraged technology to measure a broader range of skills and improve the efficiency of data collection and reporting, allowing for more timely analysis of results.9 These advances in data analysis allowed NAEP to report results by demographic subgroups, shed light on achievement gaps, and informed efforts to address educational inequities. Over time, NAEP expanded its scope to include a wider array of subjects, which reflected evolving educational priorities and provided a more comprehensive picture of student learning.10
NAEP’s long-term trend data reveal a complex picture of progress and challenge in U.S. education. In mathematics, scores for both fourth and eighth graders improved significantly between the 1970sand the early 2000s, which reflected the impact of efforts to strengthen math instruction and standards. Those gains plateaued in about 2013, and little progress was recorded in subsequent years.11 Reading scores followed a similar trajectory, and the stagnation in scores has been attributed to various factors, including a weakening of accountability policies at the federal and state level, insufficient emphasis on early literacy skills and disparities in access to high-quality instruction.12
Some of the most striking findings from historical NAEP data is the persistence of achievement gaps between demographic groups. For example, in 2019, the average reading score for Black 8th graders was 27 points lower than for their White peers, equivalent to more than two years of learning. In 2022, that number dropped slightly to 24 points, however scores were lower across the board following the pandemic.13 Students from low-income families consistently score lower than their more affluent peers, reflecting the impact of factors such as access to resources, school funding disparities, and community support systems.14
WHAT ARE THE HISTORIC TRENDS OF NAEP?
Major educational reforms have left a visible impact on NAEP results, often sparking debates about their effectiveness. In 2002, No Child Left Behind (NCLB) emphasized accountability and standardized testing, and significant shifts in instructional practices led to some improvements in NAEP math scores and a narrowing of achievement gaps. Gains in reading scores were less pronounced, however, and critics argued that the law’s focus on testing hindered progress in subjects outside math and reading.16 The rollout of Common Core State Standards in the early 2010s aimed to establish consistent academic expectations across states. However, uneven implementation of the standards, as well as difficulties aligning instruction with the new expectations, resulted in some states showing improvement while others experienced declines.17
Beyond policy changes, broader socio-political events also shaped NAEP trends. The Great Recession of 2008 led to widespread budget cuts in education, affecting school resources and teacher staffing. NAEP results from this period showed stagnation in performance, highlighting the long-term impact of economic downturns on education. More recently, the 2022 NAEP results provided the first glimpse of the learning loss caused by the COVID-19 pandemic, revealing unprecedented declines in reading and math scores and erasing nearly two decades of progress.18
The 2022 NAEP results made it clear to many states that there was an urgent need to improve education standards.
• Mississippi maintained historic gains in 4th grade reading, scoring at the national average
despite a post-pandemic decline in reading scores nationwide. Their success—often called the “Mississippi Miracle”—is the result of the state’s Literacy-Based Promotion Act (LBPA), which emphasizes screening for reading difficulties, early identification, and interventions to address the needs of at-risk students.19
• To address pandemic learning loss, the Tennessee General Assembly enacted the
Tennessee Learning Loss Remediation and Student Acceleration Act, which requires school districts and public charter schools to offer additional academic support to students.20
• Minnesota passed the Reading to Ensure Academic Development (READ) Act in 2023,
to have every child in the state reading at or above grade level every year, to support multilingual students, and to support those receiving special education services.21
WHAT ARE THE HISTORIC TRENDS OF NAEP?
Students across the country were struggling with math long before the COVID-19 pandemic, with math performance in most states declining for the past decade. There are signs of progress, however, as states begin to move policy aimed at improving education standards.
• West Virginia scored eight points under the national average for math in 2022, with
only 23% of fourth graders at or above proficiency. In response, West Virginia became the first state to pass math-specific policy with its Third Grade Success Act, which prioritizes evidence-based math instruction to ensure students achieve proficiency by the end of third grade.22 In 2024, 31% of West Virginia fourth graders scored at or above proficiency, and the average score was six points higher than in 2022.
• Arkansas policymakers passed the Arkansas LEARNS Act in 2023, mandating progress
monitoring and intervention plans for students in grades 3-8 who are falling below grade level in math. The law calls for highly effective math teachers and ensures students will receive additional support if needed.23 While the 2024 NAEP results did not show a significant difference in performance, the law is the first step toward future improvement.
• And, in Florida, new legislation requires schools to identify students struggling in math
and to provide them with the interventions they need to catch up and stay on track. Under HB7039, schools are also required to identify students exhibiting the characteristics of dyscalculia and screen for the learning disability.24 In 2024, the average score of fourth graders was higher than the national average, but there was no significant difference from 2022.
CONTINUED ON NEXT PAGE
WHAT DOES U.S. STUDENT ACHIEVEMENT LOOK LIKE IN THE 2024 NAEP RESULTS?
On January 29, 2025, the National Center for Education Statistics (NCES) released the 2024 NAEP scores, and the results are not encouraging. The average reading score for fourth graders declined by two points compared to 2022, and by five points compared to 2019. In mathematics, the average score was higher for grade 4 when compared to 2022, and not significantly different for grade 8. Both grades scored lower compared to 2019. These findings draw attention to a concerning decline in student performance, particularly in reading, and highlight the need for targeted interventions to address these challenges.
The 2024 NAEP results also revealed continuing disparities in student achievement across various demographic groups.
• Achievement gaps between White students and their Black and Hispanic peers remain
significant, despite efforts to close these gaps, spotlighting the need for continued focus on equitable educational opportunities.
• Female students generally outperformed male students in reading, while male students
showed a slight edge in mathematics, which is consistent with historical patterns observed in NAEP assessments.
• Students from lower socioeconomic backgrounds continued to score below their more
affluent peers. This gap highlights the ongoing impact of economic disparities on educational outcomes and the importance of addressing resource inequities in schools.
• Both English Language Learners and students with disabilities scored significantly
lower than their peers, emphasizing the need for specialized instructional strategies and support systems designed to meet the diverse needs of students.
There is no argument that the COVID-19 pandemic disruption had a profound impact on education, although it should be noted that the decline in NAEP scores preceded the pandemic. Nonetheless the declines in reading and mathematics scores in 2024 can be partially attributed to the disruptions caused by the pandemic. School closures, the shift to remote learning, and varying levels of access to educational resources contributed to significant learning losses, particularly among vulnerable student populations. Despite the federal government giving $190 billion to schools to aid in pandemic recovery, the 2024 NAEP results suggest that recovery has been uneven. Students who were already at a disadvantage pre-pandemic have faced greater challenges in regaining lost ground.
The results also showed the widening gap between higher- and lower-achieving students. While eighth grade math scores remain unchanged from 2022, fourth graders saw a small, two-point increase. Both groups are still lower than they were in 2019, however students in the 90th percentile improved by three points, while those at the 10th percentile declined by five points.27
The small progress in fourth grade math was due solely to the highest-scoring students, and the decline in both fourth and eighth grade reading was driven by declines among low- achieving students.28
WHAT DOES U.S. STUDENT ACHIEVEMENT LOOK LIKE IN THE 2024 NAEP RESULTS?
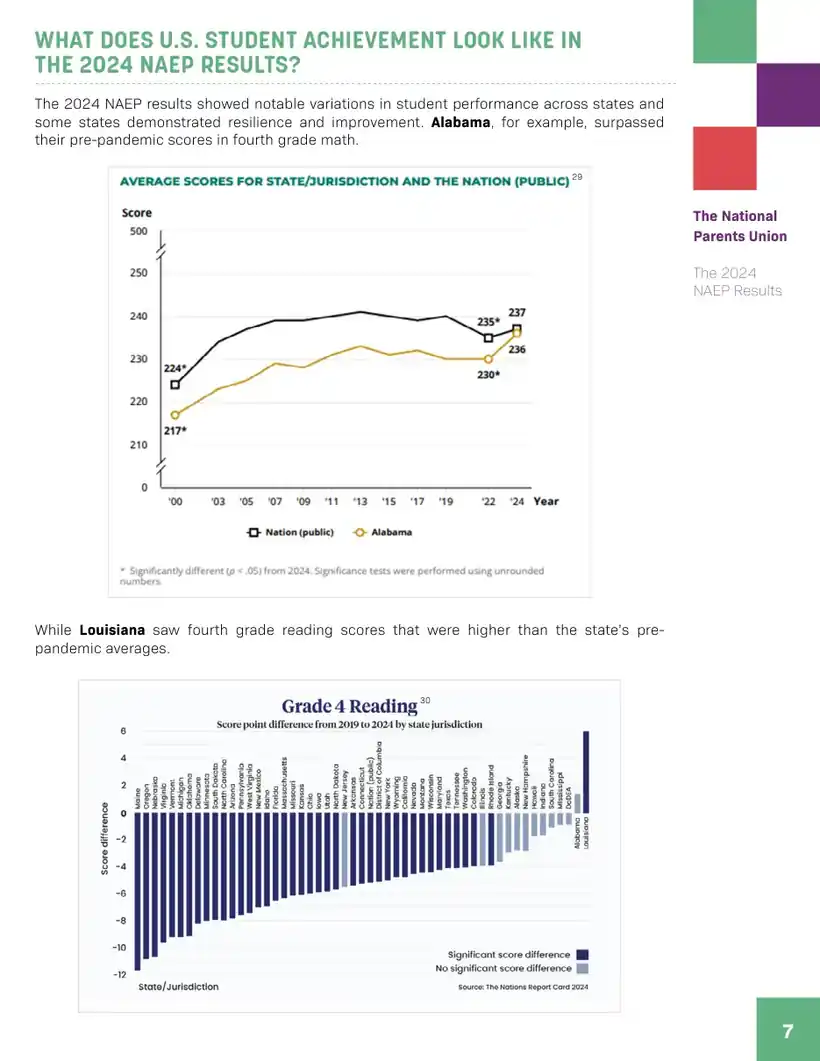
The 2024 NAEP results showed notable variations in student performance across states and some states demonstrated resilience and improvement. Alabama, for example, surpassed their pre-pandemic scores in fourth grade math.
While Louisiana saw fourth grade reading scores that were higher than the state’s pre- pandemic averages.
WHAT DOES U.S. STUDENT ACHIEVEMENT LOOK LIKE IN THE 2024 NAEP RESULTS?
However, reading scores across the board decreased compared to 2022, continuing a decline that started before the pandemic. One-third of eighth graders scored below ‘basic,’ the lowest benchmark on the test; forty percent of fourth graders fell below it as well. A fourth grader scoring below basic might not be able to determine the main idea or purpose of an informational text.31
It is clear that the 2024 NAEP findings carry significant implications for education policy at both national and state levels. The persistent achievement gaps and overall declines in performance highlight the need for equitable distribution of educational resources, and policies should focus on directing funding and support to under-resourced schools and districts to address disparities. The decline in reading proficiency suggests a need tore-evaluate literacy instruction approaches. Implementing evidence-based reading programs and providing professional development for educators could be pivotal steps. While the 2024 results are alarming, there is, on the bright side, ample evidence that states that have undertaken fundamental reforms in math and/or reading have shown better results than those that have not.
Policies that promote inclusive practices and provide additional support services to meet the needs of the most vulnerable students – such as English Language Learners, students with disabilities, and those from low socioeconomic backgrounds – are essential for improving results and closing achievement gaps. Given the ongoing impact of the COVID-19 pandemic, sustained investment in recovery strategies is crucial. This includes expanding access to tutoring, mental health services, and extended learning opportunities to help students catch up.
CONCLUSION
The kids are not alright, and the 2024 NAEP results should serve as a sobering wake-up call to the nation. This year’s data highlights continued challenges in reading and math, with overall declines in proficiency particularly among younger students. While some states and student groups showed signs of resilience or improvement, the persistent achievement gaps based on race, socioeconomic status, and disability status emphasize the systemic inequities that continue to plague U.S. education.
The long-term implications of these findings are significant. Declining student performance in core subjects such as reading and math raises concerns about the preparedness of future generations for higher education and the workforce. Allowing these trends to continue will have lasting economic and societal consequences, including lower college enrollment rates, reduced career readiness, and widening income disparities. Further, an informed citizenry is crucial for democracy, and students who are unable to understand and process informational texts will not be able to fully participate in society as adults. Addressing these challenges requires sustained investment in evidence-based educational policies, targeted interventions for at-risk students, and a commitment to reducing disparities in educational opportunities.
Policymakers at the national and state levels must consider the broader context of these findings when shaping future strategies. Closing achievement gaps and reversing declines in performance will require increased funding for under-resourced schools, professional development for educators, and expanding access to early childhood education and literacy programs. Recovery from pandemic-era learning loss must remain a national priority, with a focus on tutoring, extended learning opportunities, social-emotional support for students, and other evidence-based school improvement efforts.
NAEP is the largest ongoing measure of student achievement in the U.S, serving as an invaluable tool for assessing the effectiveness of educational policies and interventions. Its role in tracking long-term trends allows educators, policymakers, and researchers to make data-driven decisions that can shape the future of education. The continued use of NAEP as a benchmark, is essential for stakeholders to monitor progress, identify areas in need of improvement, and implement strategies that promote educational equity and excellence.
FOOTNOTES